2023-09-01 00:00:00
4 min read
In the ever-evolving landscape of technology and information, data has emerged as the lifeblood of decision-making and innovation. Across domains like database design, business analysis, and software development, the art of data modeling stands as a cornerstone that shapes the way we perceive, store, and interact with information.
A meticulously crafted data model isn't just a static representation; it's a dynamic blueprint that intricately weaves together the threads of data, revealing patterns, relationships, and opportunities that might otherwise remain hidden.
In this journey of exploration, we will unravel the essential steps to craft a robust data model—one that serves as the bedrock for precise data representation and the gateway to unlocking profound insights.
Step #1 Understand Your Data Requirements
Before delving into the intricate realm of data modeling, it's imperative to establish a clear understanding of your data's purpose and context.
Your journey begins by defining the overarching objective of your data model—whether it's streamlining inventory management, dissecting customer behavior, or enhancing operational efficiency.
Let's say you're in charge of an online store looking to improve how you suggest products to customers. Before you get into the nitty-gritty of data modeling, think about how important your data is for making the store better. Think of it like puzzle pieces that, when put together, can show you what customers like, what they buy, and when they shop.
Now, take a closer look at the different types of information you have—stuff like customer names, how much they spend, and when they make orders. By taking the time to really understand all these details, you're getting the groundwork ready for creating a data model that's accurate and useful.
This is like setting the direction for your journey. You're figuring out what important things (entities and attributes) will be part of your data model.
So, keep your focus on this step because it's like the starting point that helps you build everything else in the right way.
Step #2 Identify Entities and Attributes
Now, let's get into the nuts and bolts of your data model. Think of "entities" as the main things or ideas you want to keep track of—like customers, products, or orders in our online store example.

Each entity has specific details that matter, which we call "attributes." These attributes describe different properties or characteristics of the entities. For instance, a customer entity could have attributes like their name, email, and location. In the world of data modeling, understanding these entities and their attributes is crucial. It's like figuring out what pieces you need for your puzzle and how they fit together to give you the whole picture.
So, as you move forward, remember that identifying the right entities and attributes is like laying the foundation for your data model, making sure it captures all the important aspects accurately.
Step #3 Define Relationships Between Entities
Now, let's dive into something important: relationships between entities. Think about how things are connected in the real world. Just like people have relationships with each other, entities in your data model can have relationships too. These relationships show how different entities interact or affect each other. There are a few types of relationships:
One-to-One: This is like a direct connection between two entities. For example, think of a person's identification card. Each person has only one ID, and each ID belongs to just one person.
One-to-Many: In this case, one entity is connected to several others. For instance, a single department in a company can have many employees.
Many-to-Many: Here, multiple entities are linked to multiple others. Think of students and courses. A student can take multiple courses, and each course has many students.
These relationship types are like the threads that weave your data model together, reflecting how things in the real world interact. By understanding these relationships and using the right types, your data model becomes a powerful tool for showing how different pieces of information are connected and how they influence each other.
Step #4: Choose the Right Data Modeling Notation
Now that you've got a clear grip on your data and its connections, it's time to pick the right way to show it visually. This is where data modeling notations come in handy. Think of these notations as the tools you use to draw a map of your data model. There are a couple of common notations you can consider:
Entity-Relationship Diagrams (ERDs): These are like a classic choice. ERDs use shapes like rectangles and diamonds to represent entities, attributes, and relationships. They're great for showing the structure of your data and how things relate.

UML Diagrams: UML, which stands for Unified Modeling Language, is another option. It's often used in software development but can work well for data modeling too. UML diagrams use various shapes and symbols to depict different aspects of your data model.

The trick is to pick the notation that fits your needs best. If your data model is quite simple, you might prefer something straightforward like an ERD. On the other hand, if your model is more complex, a UML diagram might be more helpful. Also, consider your audience. If they're familiar with a specific notation, using that one can make things easier to understand. So, like choosing the right tool for a job, selecting the suitable notation helps you communicate your data model clearly and effectively.
Step #5: Create the Data Model Diagram
Alright, now it's time to put your understanding into action and create that visual representation of your data model. Follow these steps to bring your data model to life:
Start with Entities: Draw the entities you've identified as rectangles in your chosen notation. Label each entity with its name.
Add Attributes: For each entity, draw ovals or rectangles attached to it to represent attributes. Write down the attribute names inside these shapes.
Show Relationships: Use lines with specific symbols to show how entities are related. For example, a line with a "crow's foot" at one end indicates a one-to-many relationship.
Define Cardinality: Along the relationship lines, indicate the cardinality using numbers or symbols. This helps show how many entities are involved in each relationship.
Refine and Review: Once you've got the basic diagram, take a step back and review it. Make sure everything is clear and accurately represents your data.
Iterate if Needed: If something doesn't seem right or you missed a detail, don't hesitate to tweak your diagram. Data modeling is about refining and improving.
So, by following these steps, you'll have a well-structured data model diagram that accurately mirrors the relationships and attributes you've identified.
Step #6: Validate and Refine the Data Model
Now that you've got your data model diagram in place, it's time to make sure it's solid and accurate. This step is crucial because a small mistake can lead to big problems down the road. Here's how to ensure your data model is on point:
Review Thoroughly: Take a good look at your diagram. Make sure all the entities, attributes, and relationships you've included are correct and make sense in the context of your project.
Get Feedback: It's a smart move to get others involved. Share your diagram with stakeholders, colleagues, or experts who know about the data. They might spot things you missed or suggest improvements.
Check for Gaps: Look for gaps in your data model. Are there entities or relationships you didn't consider? Are there attributes missing that are important for understanding the data?
Eliminate Inconsistencies: Ensure that the relationships and cardinalities you've defined match the reality of your data. If something seems off, make adjustments.
Refine as Needed: Based on the feedback and your own analysis, refine your data model diagram. This might involve adding, modifying, or removing elements.
Think of this step as quality control. Just like you'd double-check a document before submitting it, you're making sure your data model accurately represents the real world. By being thorough and open to feedback, you're taking a proactive approach to catch any issues early on.
Remember, a well-validated data model is like a sturdy bridge that supports accurate analysis and decision-making. So, don't rush through this step—invest the time to ensure your data model is rock-solid.
Data modeling, stripped of complexity and adorned with practicality, serves as a linchpin across realms as diverse as database management, business strategy, and software development.
By understanding data requirements, identifying entities and attributes, defining relationships, selecting the right notation, crafting visual diagrams, and validating your model, you've embarked on a voyage that transforms abstract data into actionable insights.
Remember, a well-crafted data model isn't a static artifact—it's a living, evolving map that guides your understanding and decision-making. As you apply the knowledge gained here, seize the opportunity to explore more advanced concepts, experiment with diverse notations, and refine your skills further.
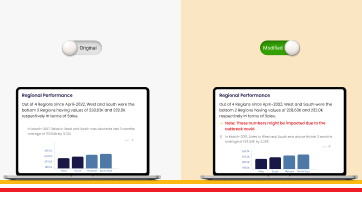
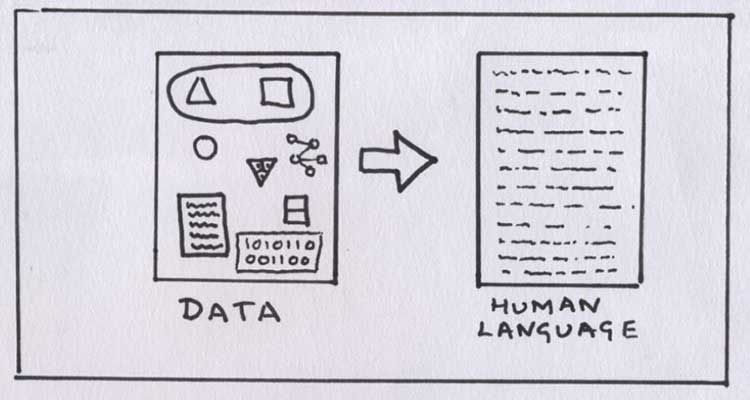
We at Phrazor create business intelligence tools which helps you generate Narrative Insights in Natural Language from your Data.
Fortune 500 companies leverage Phrazor Application to create automated Narrative Reports for their stakeholders.
Using Phrazor Visual and Phrazor Extension for Power BI and Tableau respectively, you can summarize your dashboards in natural language.
CPG and Pharma companies leverage Explorazor to search through their data using keywords instead of writing lengthy and complex SQL queries.
About Phrazor
Phrazor empowers business users to effortlessly access their data and derive insights in language via no-code querying